16 Eye-Opening Corporate Grant and In-Kind Gift Statistics

If your nonprofit isn’t tapping into the power of corporate giving, you could be leaving significant support on the table. From grant programs to in-kind (or non-cash) donations, companies are increasingly investing in purpose-driven partnerships with nonprofits—and the numbers here prove it. In this post, we’ve compiled 16 eye-opening corporate grant and in-kind gift statistics that highlight the immense potential of these opportunities.
Specifically, we’ll cover:
- Top Corporate Grant Statistics Your Nonprofit Should Know
- In-Kind Gift Statistics That Inspire Action
Whether you’re looking to expand your funding streams, strengthen donor relationships, or boost your organization’s impact, these insights will help you better understand where the opportunities lie—and how to position your nonprofit for success.
Top Corporate Grant Statistics Your Nonprofit Should Know
Corporate grants can be a game-changer for nonprofits, but securing them requires understanding the landscape. From funding trends to application success rates, the right data can reveal where the opportunities are and how to maximize your chances.
That’s why here, we’re sharing the top corporate grant statistics every nonprofit should know.
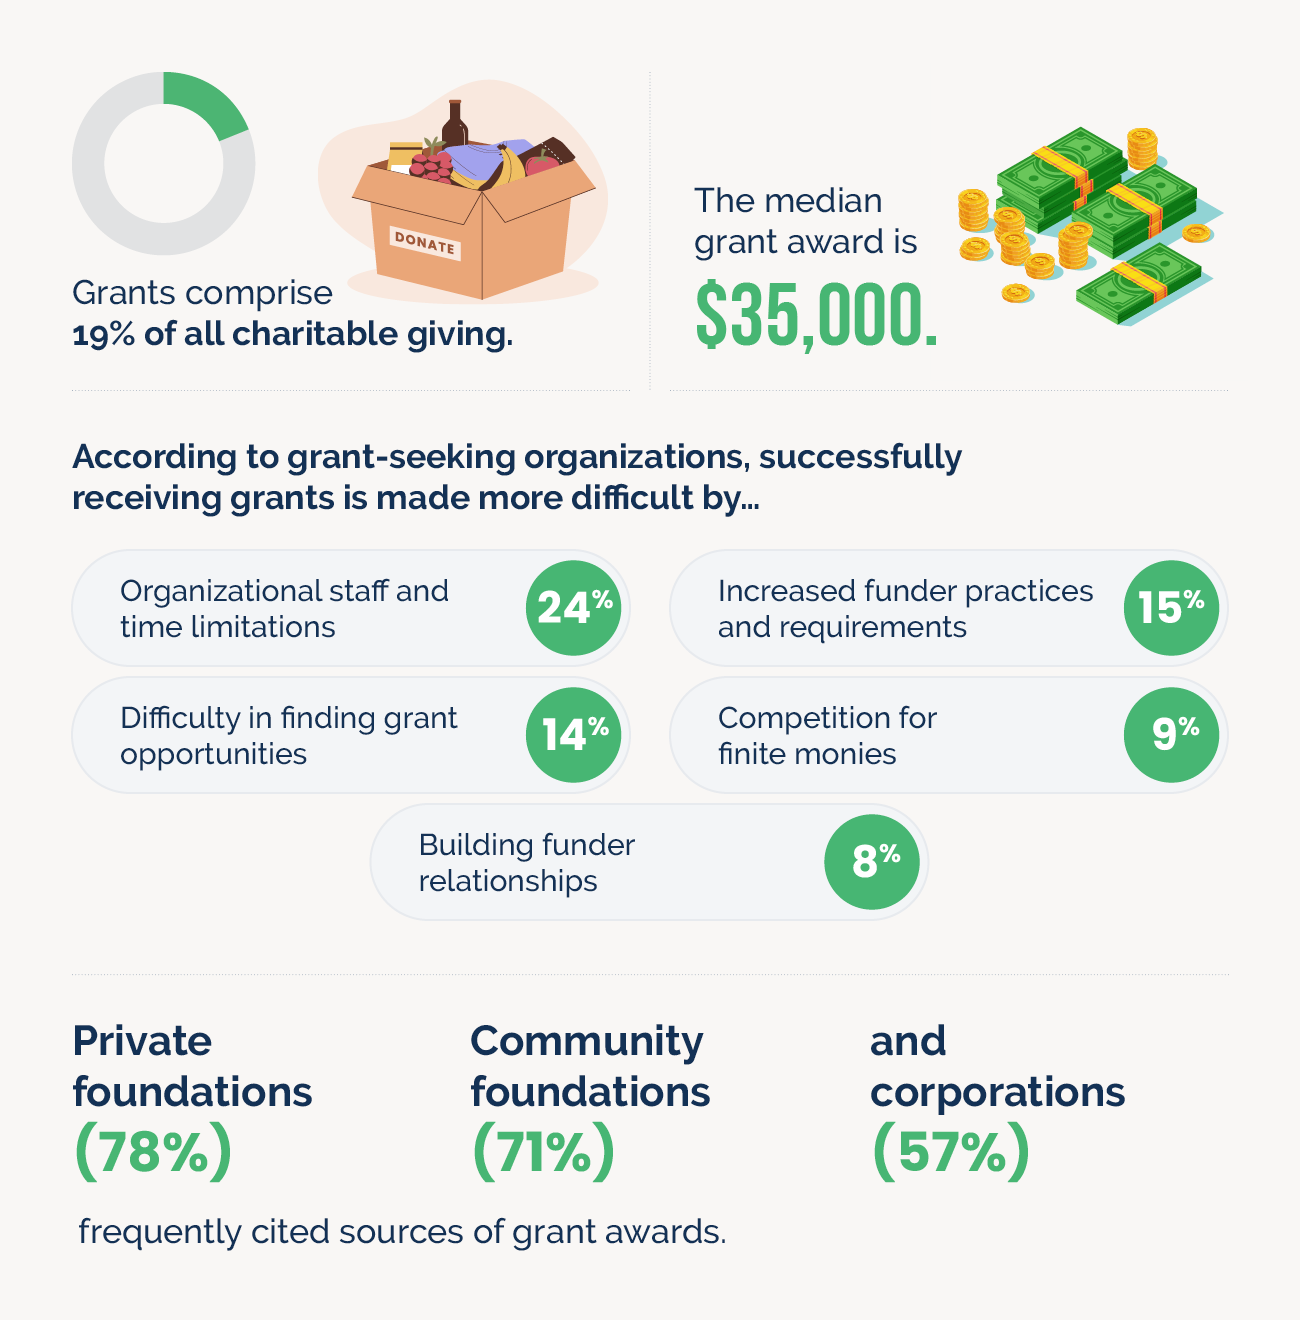
1. Grants comprise 19% of total charitable giving.
Grants comprise a significant portion of the overall giving landscape. While individual donors often receive the spotlight, this statistic serves as a clear reminder that institutional funding remains a powerful and steady source of support for nonprofits.
If your organization isn’t actively pursuing grant opportunities—especially from corporations—you could be missing out on nearly one-fifth of the giving pie. Not to mention, corporate grants often come with larger dollar amounts than individual donations and may open the door to longer-term partnerships, employee engagement, and even in-kind support.
Source: Giving USA
2. The median grant award falls around $35,000.
When it comes to grant amounts, the numbers can vary widely, but the median award sits at approximately $35,000. That means that roughly half of all grant awards are larger than this amount, making it a strong benchmark for what many nonprofits can reasonably expect to receive.
Think about it: a $35,000 grant can be transformative. It might fund an entire program, cover critical operational costs, or provide your organization with the room to innovate and grow. Understanding this median helps set realistic goals when applying for grants and illustrates the value of dedicating time and resources to your grant-seeking efforts.
Source: Double the Donation
3. The total number of grant-making institutions has risen from 47,000 to more than 84,000 over the past 15 years.
In just over a decade and a half, the number of grant-making institutions—including corporations, foundations, and other grant funders—has nearly doubled. This dramatic increase reflects a broader shift toward philanthropy and a growing commitment to social impact across sectors.
This surge in grant-making institutions also means there are now more opportunities than ever for nonprofits to secure funding. More funders equals more potential partners—and more chances to find those aligned with your mission, community, or program focus.
Source: GrantProposal.info
4. 91% of nonprofit survey respondents submitted at least one grant application the previous year.
According to recent survey data, a vast majority of nonprofits submitted at least one grant application in the past year. Even more encouraging: of those who applied, more than 88% were awarded at least one grant. These numbers indicate that most nonprofits are actively pursuing grant funding, and many are achieving success.
This statistic is both a confidence booster and a wake-up call. It confirms that applying for grants is a widely used—and largely successful—fundraising strategy. But it also suggests that if your organization isn’t submitting grant proposals regularly, you could be falling behind your peers and missing real opportunities.
Source: GrantStation
5. According to grant-seeking organizations, successfully receiving grants is made more difficult by…
- Organizational staff and time limitations (24%)
- Increased funder practices and requirements (15%)
- Difficulty in finding grant opportunities that match specific missions, locations, or programs (14%)
- Competition for finite monies (9%)
- Building funder relationships (8%)
While many nonprofits are successfully securing grants, the process isn’t without its hurdles. These insights highlight that the most significant challenges are often internal—limited staff capacity and time—followed closely by external factors like complex funder requirements and competitive landscapes.
The good news? Most of these barriers can be addressed with the right strategy and tools.
Source: GrantStation
6. 51% of nonprofit survey respondents reported grant funding as comprising 25% or less of their annual budget.
More than half of the surveyed nonprofits say that grants account for only 25% or less of their total annual budget. This suggests that while grants are a significant revenue stream, many organizations continue to rely heavily on other sources, such as individual donations, events, and earned income.
However, this statistic reveals a key opportunity: there’s room to grow your grant funding. If grants currently make up a small portion of your budget, expanding your efforts in this area could help diversify your revenue and create more financial stability.
Source: GrantStation
7. Median total awards ranged from $14,500 for small organizations to over $2.8 million for extra-large or enterprise-level organizations.
Grant size often correlates with organizational size. The trend is clear: larger nonprofits consistently secure larger grant amounts.
While it might feel like large organizations have the upper hand, this statistic isn’t meant to discourage—it’s meant to inform your strategy. Funders often base award size on an organization’s capacity, track record, and ability to manage and scale impact. Understanding this dynamic can help your nonprofit set realistic expectations and position itself for growth.
Source: GrantStation
8. The median size of awards ranged from $25,000 for animal-related organizations to $1.5 million for educational institutions.
Grant funding isn’t one-size-fits-all. In fact, statistics show that the median size of grant awards can vary dramatically based on an organization’s mission focus.
This variation underscores the importance of understanding how your mission area aligns with funder priorities and typical funding ranges. Some sectors, such as education, healthcare, and human services, often attract larger grants due to their broad societal impact or high-cost programming. Others, such as arts or animal welfare, may receive smaller average awards but benefit from more mission-specific or grassroots-focused funders.
Source: GrantStation
9. Corporations were the third most frequently cited source of grant awards to nonprofit causes (57%), following private foundations (78%) and community foundations (71%).
When it comes to grant funding, corporations rank as the third most frequently cited source of support, with 57% of nonprofit respondents reporting they received at least one corporate grant. This trails behind private foundations (78%) and community foundations (71%), but still represents a significant—and growing—slice of the funding landscape.
Source: GrantStation
10. 8% of respondents reported corporate grants as the largest source of their total funding.
While many nonprofits pursue a mix of revenue streams, only 8% of surveyed organizations reported that corporate grants make up the most significant portion of their total funding. This suggests that while corporate support is common, it’s not often the primary source of income for most nonprofits.
This statistic reveals both a challenge and an opportunity. Corporate grants are underutilized as a primary funding source—possibly due to limited outreach, eligibility concerns, or misconceptions about corporate giving capacity. However, for organizations that successfully establish strong corporate partnerships, the rewards can be substantial and enduring.
Source: GrantStation

In-Kind Gift Statistics That Inspire Action
When it comes to nonprofit support, cash isn’t the only currency that counts. In-kind gifts—or any donations of goods, services, or expertise—can be just as valuable, helping organizations stretch budgets, expand programs, and meet critical needs.
But how common are in-kind donations? Who’s giving them, and why? Here, we’re diving into key in-kind gift statistics that shine a light on the scale and impact of non-cash contributions from companies and beyond.
11. U.S. donors (including individuals, businesses, and government agencies) contribute roughly $58 billion in-kind to nonprofits each year.
Every year, donors collectively contribute billions of dollars worth of in-kind goods and services to nonprofits across the U.S. These non-cash contributions—ranging from products and equipment to professional services and technology—represent a massive pool of untapped potential for many organizations.
For nonprofits looking to stretch their budgets and enhance their impact, in-kind donations can be just as valuable as financial gifts. This figure highlights how much support is available beyond the check—and how important it is to have a strategy for accessing it.
Source: Georgia Institute of Technology
12. Between 46 and 67% of surveyed companies make in-kind donations on at least an annual basis.
This statistic reveals that more than half of the surveyed companies are consistently engaging in in-kind giving. More specifically, 50% of startups, 46% of mid-level, and 67% of leading corporations were reported to have made in-kind donations at least once a year.
This underscores the idea that in-kind contributions—such as products, services, or expertise—are a mainstream component of corporate philanthropy. For nonprofits, it highlights a key opportunity: building partnerships that extend beyond cash donations and tapping into the valuable goods and resources companies are already prepared to share on a regular basis.
Source: Life Science Cares
13. Corporate philanthropy has grown by more than 50% since 2019, a trend that has coincided with a rise in in-kind donations.
Corporate philanthropy has seen a significant surge in recent years, with a major driver of this increase being the rise in in-kind donations, particularly from the pharmaceutical industry. In 2024 alone, drugmakers contributed an estimated $24 billion in donated insulin and other pharmaceutical products—a 41% increase compared to 2019.
For nonprofits, this trend signals a growing opportunity to diversify support beyond traditional funding by actively pursuing in-kind partnerships—especially with companies in sectors like healthcare, tech, and logistics that can offer high-value resources aligned with their missions.
Source: The Darien Times
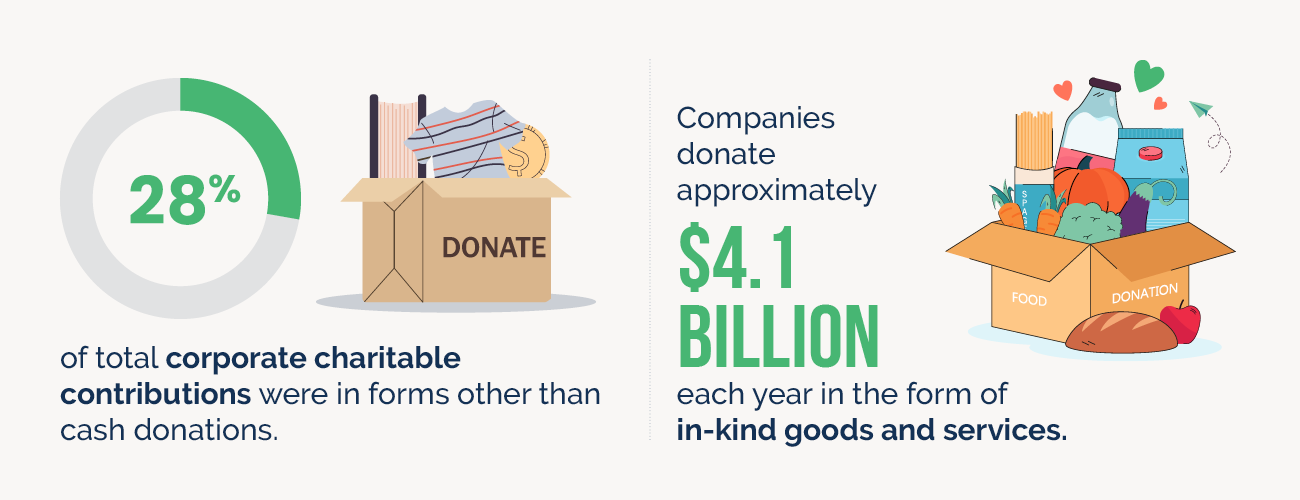
14. Companies reported that more than 28% of their total charitable contributions were in forms other than cash donations.
In other words, nearly one-third of corporate philanthropy is delivered through means other than direct financial support. If your organization is only pursuing cash grants or sponsorships from companies, you may be overlooking a significant portion of their charitable giving.
Many businesses are eager to support nonprofits through in-kind donations, skilled volunteerism, pro bono services, or product partnerships—especially when those contributions align with their core business strengths.
Source: Charitable Contributions of Food Inventory
15. Corporate gifts of products or services were reported by 27% of nonprofit survey respondents.
While this number reflects a solid level of corporate engagement, it also reveals that the majority of nonprofits may not yet be fully tapping into this valuable form of support.
If your organization is not among the 27% that receive corporate in-kind gifts, you may be missing out on substantial support that reduces expenses and boosts program capacity.
Source: GrantStation
16. Companies donate approximately $4.1 billion each year in the form of in-kind goods and services.
This includes everything from donated products and equipment to professional services, software, and skilled volunteer hours, offering nonprofits substantial value beyond direct financial gifts.
Source: Georgia Institute of Technology
Wrapping Up & Additional Corporate Giving Resources
Corporate support is a powerful yet often underutilized tool for advancing your mission. Still, these findings underscore a clear trend: businesses want to give back, and they’re actively seeking nonprofit partners to make that happen. If you’re looking to take advantage of these corporate grant and in-kind gift statistics, databases like Double the Donation include all of these programs and more to help streamline your search and application processes.
By leveraging this data, your organization can craft more innovative outreach strategies, build stronger corporate relationships, and unlock new streams of funding and resources. Now’s the time to take a fresh look at your corporate engagement efforts—and turn these insights into action.
Interested in learning more about corporate grants, in-kind giving, and beyond? Check out these additional resources:
- The Complete List of Corporate Giving and Matching Gift Statistics. Dive even deeper into the data with this comprehensive collection of statistics. Explore up-to-date statistics on corporate philanthropy, matching gift programs, employee giving trends, and more.
- Free Download: How to Secure Corporate Grants & In-Kind Giving. This step-by-step guide walks you through the process of identifying, applying for, and winning corporate support. It’s chock-full of expert tips, strategy recommendations, and actionable tools to help your nonprofit succeed.
- New: Corporate Sponsorships Available Within Our Database. Our database contains a growing list of companies actively seeking nonprofit partners for sponsorships, including through corporate grants and in-kind donations. Use this tool to find the best-fit opportunities for your organization!