Top Nonprofit Fundraising Statistics to Know: Updated 2024
Fundraising is necessary for your nonprofit’s survival, but it’s also a resource- and time-intensive process. To help your organization understand what impacts donors’ decision to give, we’ve laid out some of the top nonprofit fundraising statistics to understand.
We’ve broken these stats into relevant categories to help you where you need it most:
- Overall Fundraising Statistics
- Email Fundraising Statistics
- Social Media Fundraising Statistics
- Online Donation Statistics
- Recurring Giving Statistics
- Mobile Giving Statistics
- Year-End Giving Statistics
- Corporate Giving Statistics
Note that while most of these statistics focus on donors in the United States and Canada, much of this information and the lessons they teach are relevant worldwide. Let’s jump in!

1. Overall Fundraising Statistics
Here are some key overall fundraising statistics to help illustrate the current state of giving:
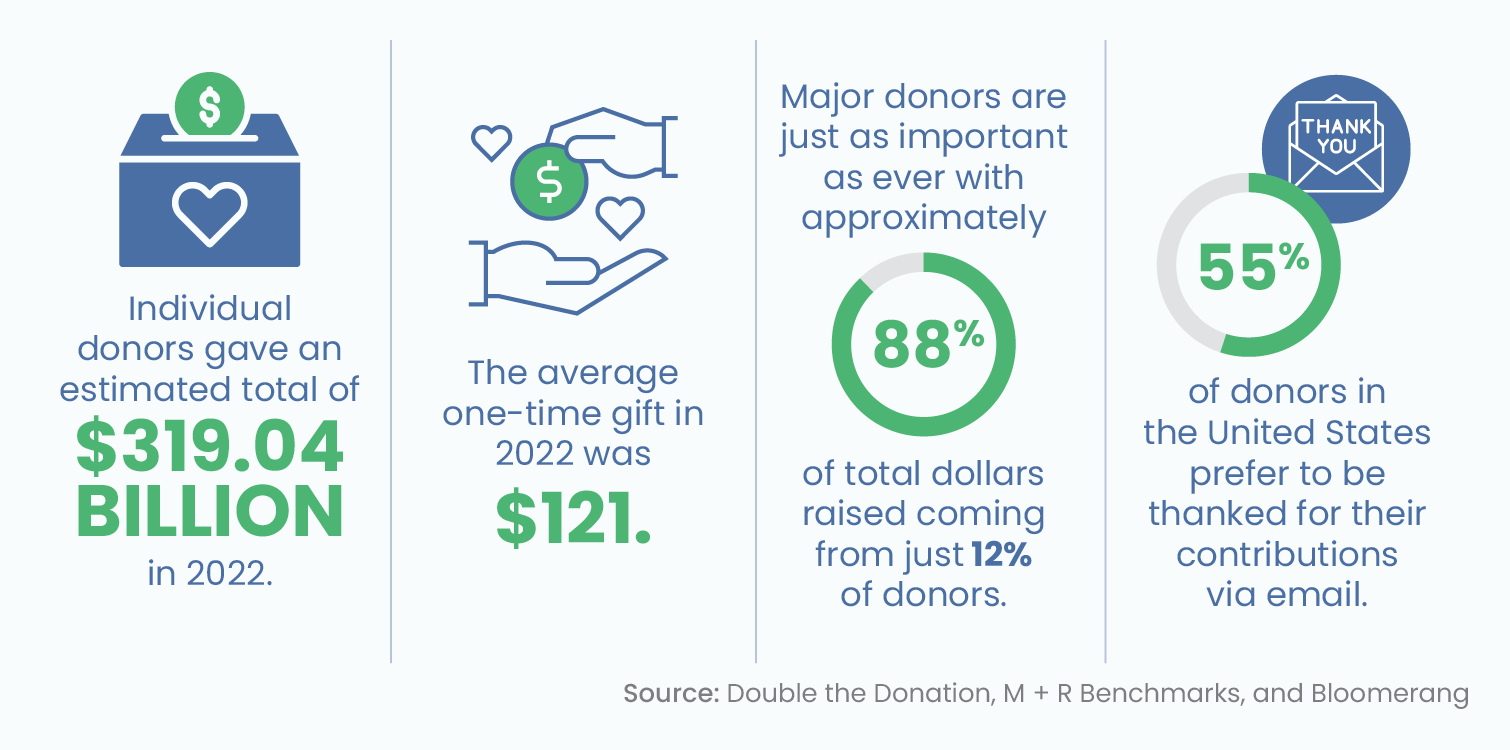
- Individual donors gave an estimated total of $319.04 billion in 2022, representing 64% of the $499.33 billion total giving.
- Overall fundraising decreased in 2022.
- The average one-time gift in 2022 was $121, up from $115 the previous year. The average monthly gift was $25, up from $24.
- 90% of Millennial donors are motivated to give by a compelling mission rather than a specific organization.
- Young donors are more likely to engage in and support a cause if their peers are already doing so.
- Major donors are just as important as ever with approximately 88% of total dollars raised coming from just 12% of donors.
- 55% of donors in the United States prefer to be thanked for their contributions via email.
- The average donor age is 75.
- Location matters with about 80% of donors giving to local organizations.
- Current events highly impact what types of causes see support. For example, nonprofits dedicated to disaster and international aid reported an 8% increase in donation amounts in 2022, whereas almost all other types of nonprofits reported a decrease from the prior year.
The takeaway? Pay attention to your individual donors’ preferences to cultivate lasting and valuable relationships.
2. Email Fundraising Statistics
Here are some important email fundraising statistics to note:
- Response rates to fundraising emails are on the decline with click-through, page completion, and conversion rates all decreasing. However, unsubscribe rates have also declined.
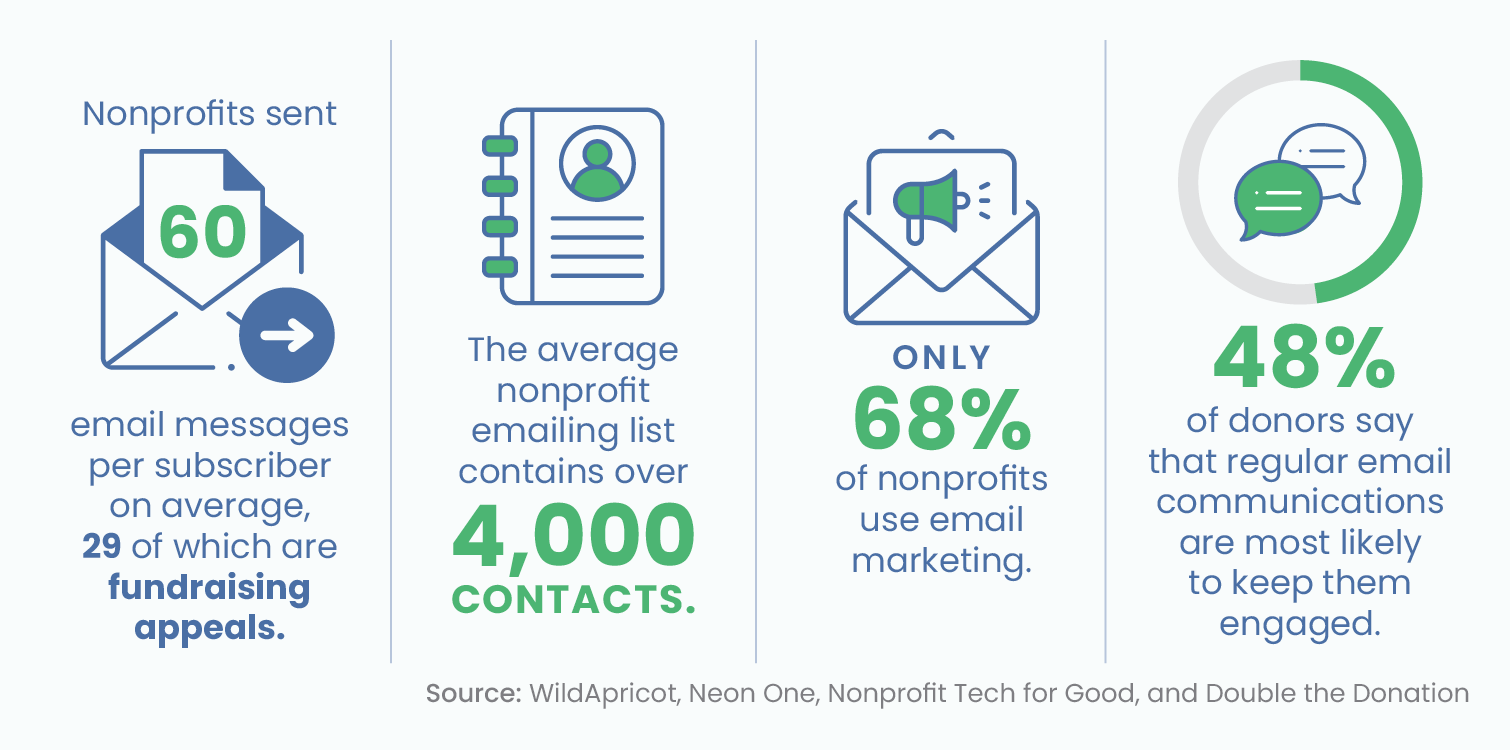
- Nonprofits sent 60 email messages per subscriber on average, 29 of which were fundraising appeals.
- The average nonprofit emailing list contains over 4,000 contacts.
- On average, nonprofits raise $90 for every 1,000 emails sent.
- Email open rates for nonprofits are unreliable as Apple’s 2021 privacy policy update can lead to false open reports for Apple device users.
- Only 68% of nonprofits use email marketing. Of those nonprofits, 41% send newsletters monthly, 27% quarterly, 17% twice monthly, 10% weekly, 3% twice weekly, and 2% daily.
- Email communications sent on a regular basis are most likely to encourage repeat donations from donors, with 48% of donors reporting that regular email communications are most likely to keep them engaged.
- While email list numbers are on the decline, nonprofit mobile messaging lists saw an 11% increase in subscribers.
The takeaway? Email is facing challenges, but it can still be an effective communication strategy when done strategically. Curate your content, be intentional with what your fundraising emails say and ask for, and segment your donors effectively.
3. Social Media Fundraising Statistics
These are some of the top social media fundraising statistics:
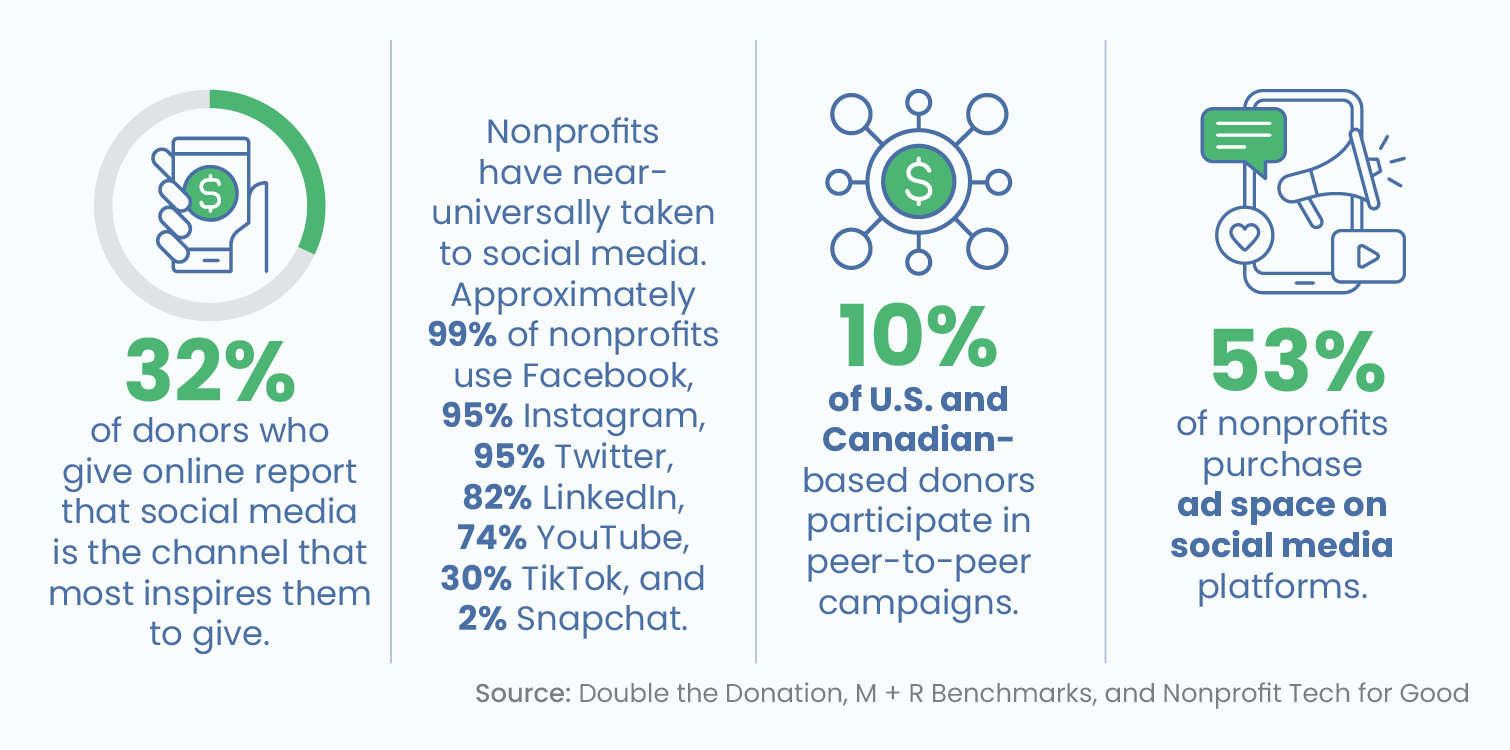
- 32% of donors who give online report that social media is the channel that most inspires them to give, a significant increase from the previous year.
- Nonprofits have near-universally taken to social media. Approximately 99% of nonprofits use Facebook, 95% Instagram, 95% Twitter/X, 82% LinkedIn, 74% YouTube, 30% TikTok, and 2% Snapchat.
- The average Facebook Fundraiser has an individual gift size of $34.
- Facebook giving made up 1.1% of all online revenue.
- When it comes to content, posts that evoke a joyful emotional response are the most widely shared.
- 62% of donors who give to crowdfunding campaigns are new to crowdfunding.
- 10% of U.S. and Canadian-based donors participate in peer-to-peer campaigns.
- 69% of nonprofits use peer-to-peer fundraising as a digital marketing method.
- According to nonprofit marketers, social media is the second most effective digital fundraising tool nonprofits have just after their organization’s websites.
- 53% of nonprofits purchase ad space on social media platforms. However, ad spending does not always equal its return on investment, as increased ad spending for nonprofit events was found not to correlate to higher event income.
- When it comes to the future of social media platforms, 23% of marketers say Instagram is the top platform for growth, 19% TikTok, 18% Facebook, 15% YouTube, 7% LinkedIn, and 6% Twitter/X.
The takeaway? Social media is a viable marketing platform that can drive revenue if it’s backed up with the right content and engagement strategies. Otherwise, it can waste your nonprofit’s time and money. Post joyful content, understand what platforms your audience uses, and rethink purchasing social media ads if it’s not necessary.
4. Online Donation Statistics
Check out these top online fundraising statistics:
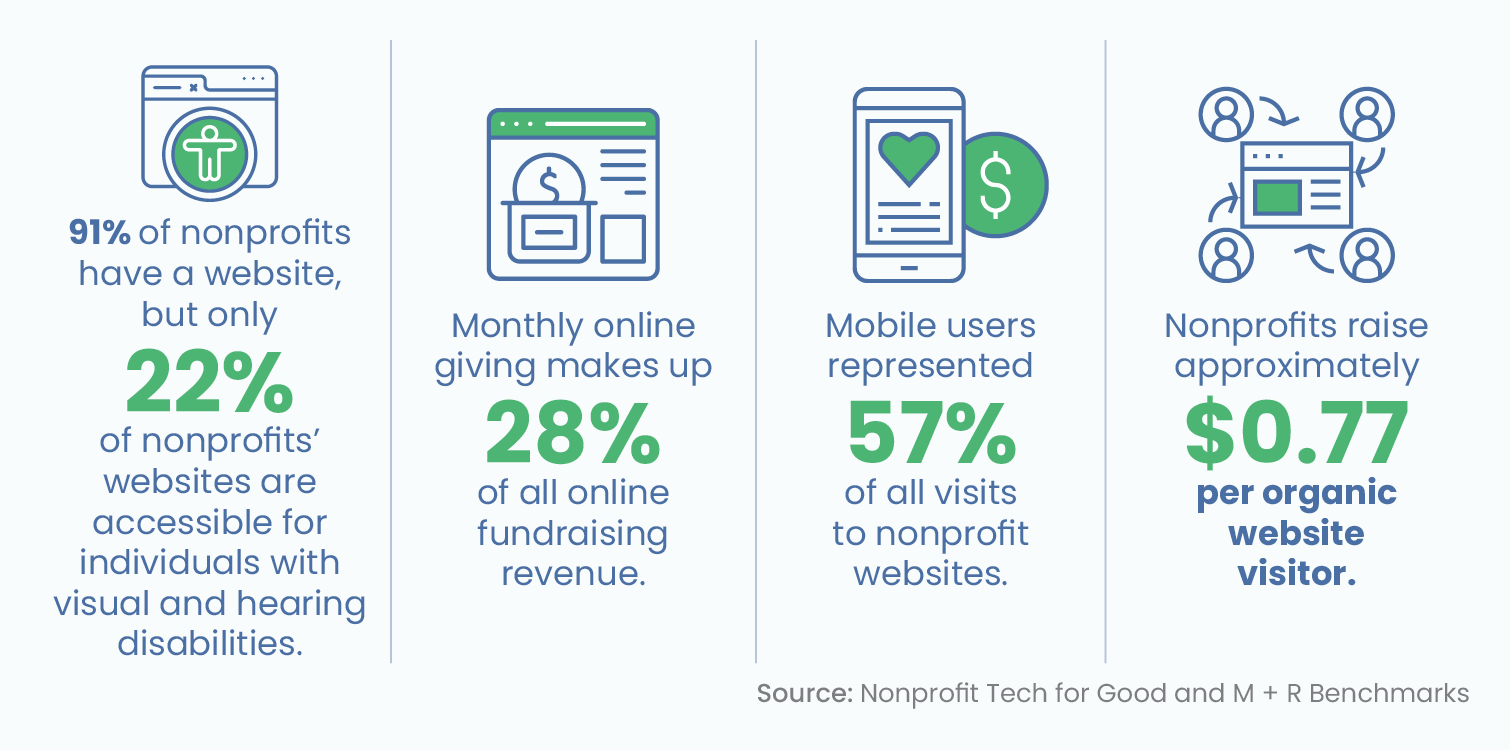
- 91% of nonprofits have a website, but only 22% of nonprofits’ websites are accessible for individuals with visual and hearing disabilities.
- Monthly online giving makes up 28% of all online fundraising revenue.
- 63% of donors prefer to give online with a credit or debit card, followed by direct mail (16%), PayPal (10%), wire transfer (5%), cash (4%), digital wallet (1%), and text-to-give (1%).
- 94% of nonprofits have mobile-optimized websites.
- Mobile users represented 57% of all visits to nonprofit websites, but desktop users made up the majority of donations at 63%.
- Organic visitors to a nonprofit’s website (who arrived via searching a specific keyword in a search engine vs. navigating straight to a website) made up 38% of total nonprofit web traffic.
- Nonprofits raise approximately $0.77 per organic website visitor.
- When it comes to website security, 84% of nonprofits have an SSL certificate for their website, 68% of nonprofits have a plan in place in the event of a cyberattack, and 27% have experienced cyberattacks.
The takeaway? Your website is the core foundation for everything your nonprofit does, including fundraising, promoting events, and communicating with your community. Even when other marketing channels have exciting opportunities, don’t neglect your website and make sure its look, functionality, and donor experience remain high-quality.
5. Recurring Giving Statistics
Here are some important recurring giving statistics to note:
- While revenue from one-time online giving decreased by 12% in 2022, revenue from monthly giving increased by 11% and accounted for 28% of all online giving.
- On average, annual revenue per one-time donor is $192 and annual revenue per monthly donor is $287.
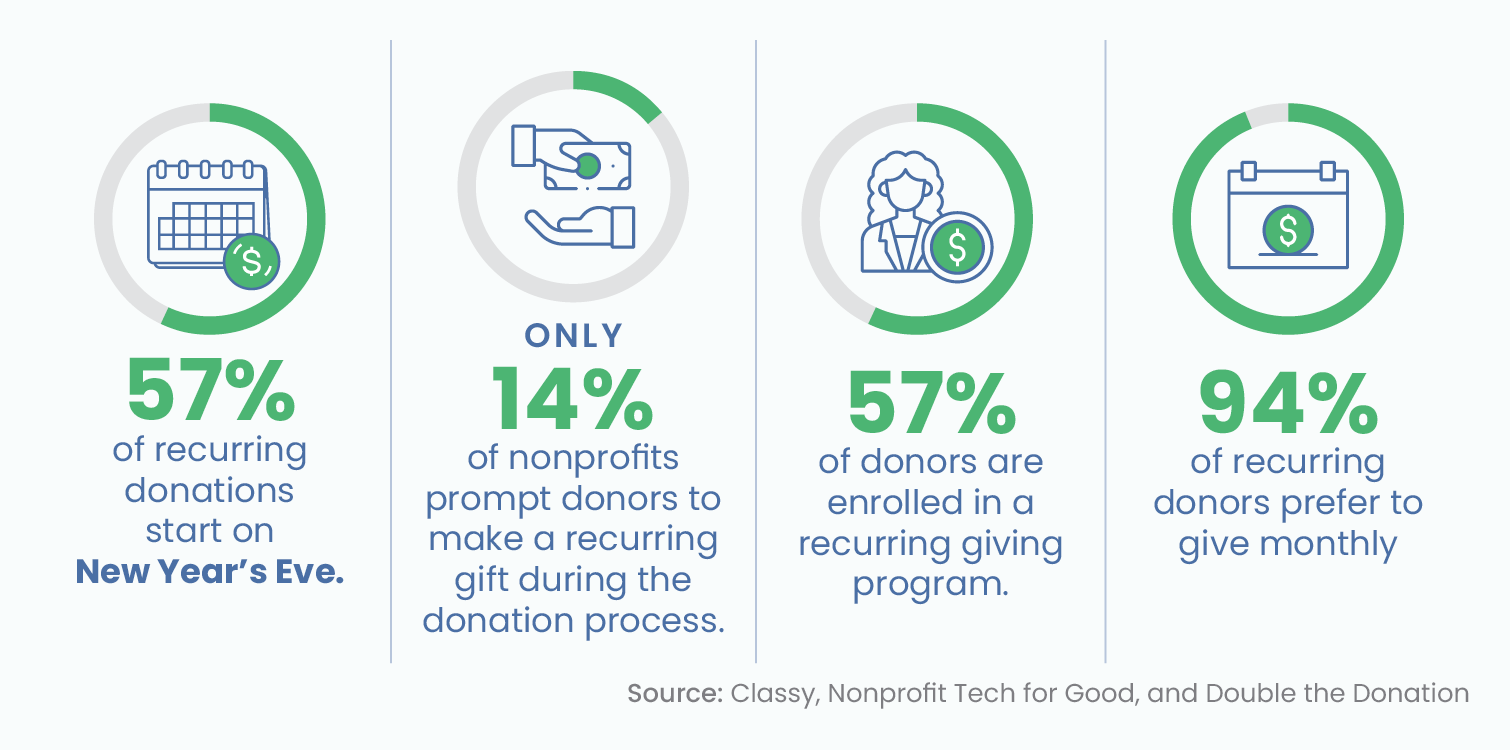
- Holidays are an effective time to cultivate recurring gifts, with 57% of recurring donations starting on New Year’s Eve.
- Only 14% of nonprofits prompt donors to make their donation a recurring gift during the donation process.
- 91% of organizations stop acknowledging recurring gifts by the third month.
- 1 in 4 nonprofit organizations don’t try to re-secure a recurring donation after a credit card number change.
- A pop-up message that asks a donor to make their one-gift gift a recurring gift results in a 64% increase in monthly donations.
- Retention rates for new online donors are only 16% but rise to 40% for long-term donors.
- 57% of donors are enrolled in a recurring giving program, up 46% from the previous year.
- 94% of recurring donors prefer to give monthly, 3% weekly, 2% annually, and 1% quarterly.
The takeaway? Encouraging recurring gifts is the single best and simplest thing you can do to grow your giving program sustainably. The fact that so few nonprofits ask for recurring gifts is shocking, so make sure you are not one of those organizations! Make active asks, steward and thank your donors for their contributions, and survey them to learn more about their giving preferences.
6. Mobile Giving Statistics
Here are some important mobile giving statistics:
- The average gift by mobile users is $79, while tablet users give $96, and desktop users give $118.
- Mobile messaging subscriber lists increased by 11%.
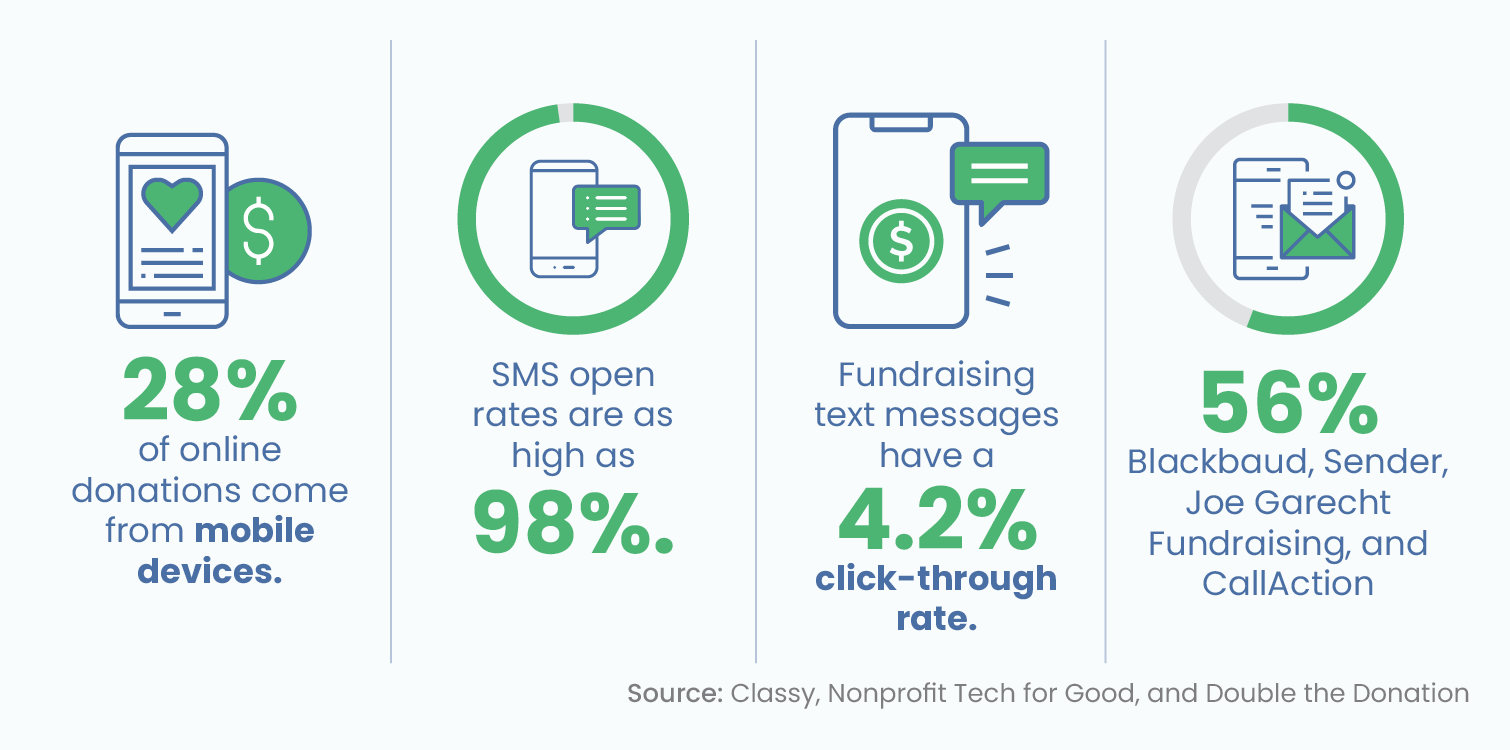
- 28% of online donations come from mobile devices.
- SMS open rates are as high as 98%.
- Fundraising text messages have a 4.2% click-through rate.
- 56% of all emails are read on a mobile device.
- 98% of Millennials and 98% of Gen Z own smartphones.
- 22% of nonprofits utilize text-to-give.
- Text message volume grew by 28% overall for nonprofits last year.
The takeaway? Mobile internet usage and donations are just as, if not more, popular as desktop giving. Expand your outreach through text messaging, check that you have accurate contact information with email and phone appends, and make sure your website is mobile-friendly. Use your mobile fundraising appeals intentionally, such as during events. Broad text campaigns can work, but only if your content and the timing are right, such as texting for support in the wake of a natural disaster.
7. Year-End Giving Statistics
Here are some key year-end giving statistics:
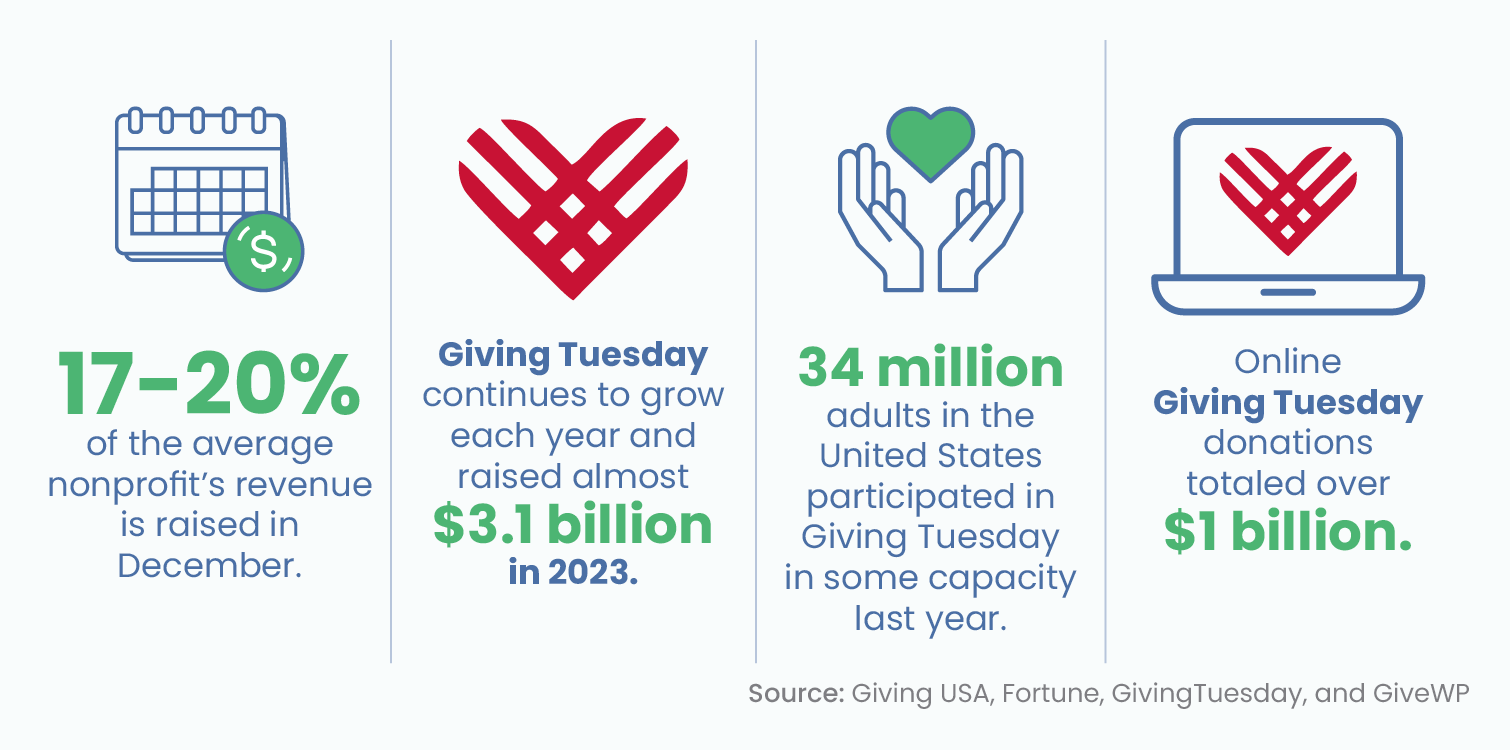
- 17-20% of the average nonprofit’s revenue is raised in December with a notable fundraising spike on the last day of the month.
- Giving Tuesday continues to grow each year and raised almost $3.1 billion last year, over $1 billion of which was from online giving.
- 10% fewer donors participated in Giving Tuesday than the previous year.
- Donations made on Giving Tuesday account for 3% of all online fundraising.
- 34 million adults in the United States participated in Giving Tuesday in some capacity last year.
- Giving Tuesday received more than 20 billion social media impressions.
- 82% of nonprofits that participated in Giving Tuesday tried out a new fundraising or marketing strategy.
The takeaway? The end of the year is the most important time to fundraise. Plan your year-end fundraising strategy months in advance to be ready for Giving Tuesday and the holiday season. This is also a good time to try out new messaging strategies since engagement is likely to be high at this time of the year. However, since there has been a decline in the total number of donors in recent years, prioritizing retention might be the smart choice for next Giving Tuesday.
8. Corporate Giving Statistics
Take a look at these noteworthy corporate giving statistics:
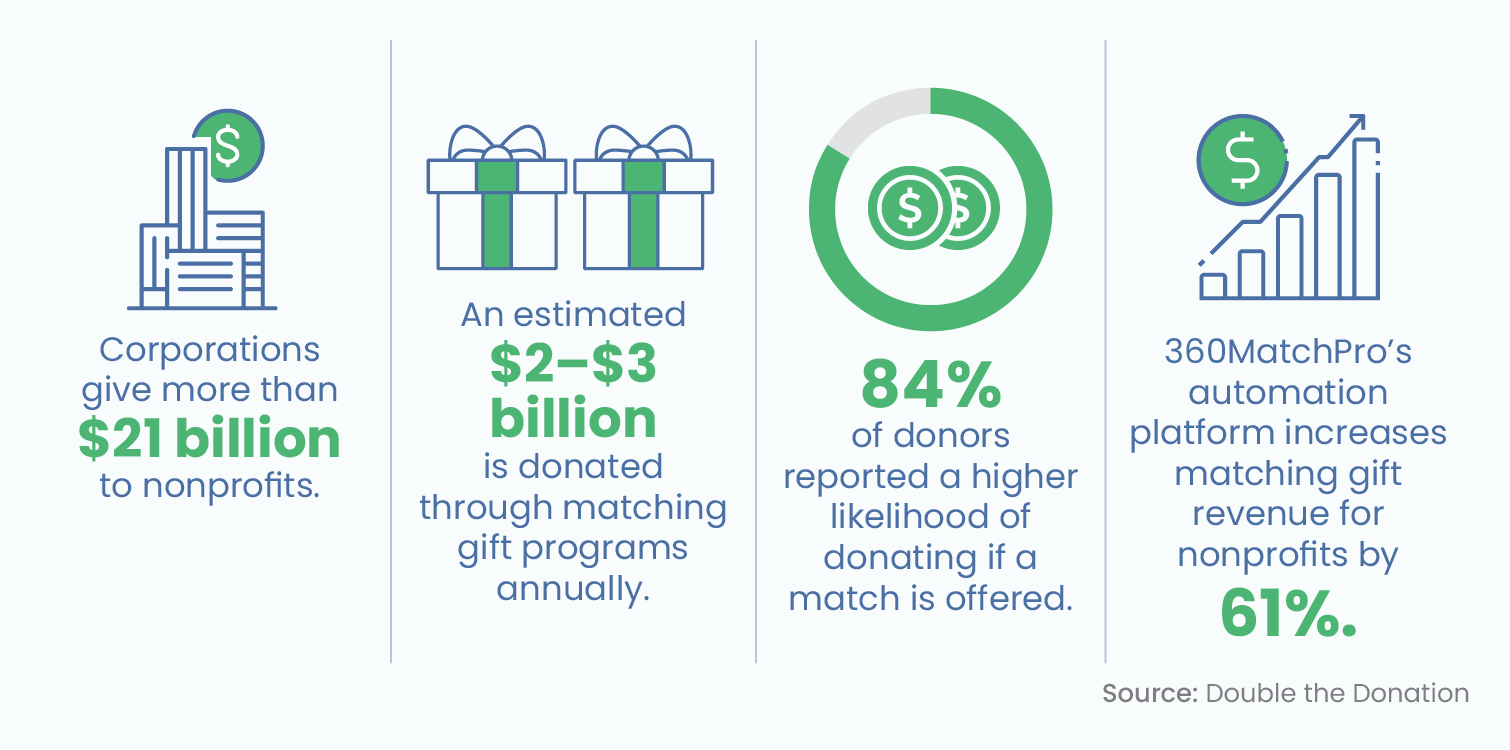
- Corporations give more than $21 billion to nonprofits.
- While an estimated $2–$3 billion is donated through matching gift programs annually, more than $6–$10 billion in available matching gift funding goes unclaimed each year.
- Over 26 million individuals work for companies with matching gift programs. However, 78% of these donors are unaware of whether their company offers a matching gift program or what the specifics are.
- 40% of Fortune 500 companies offer volunteer grant programs.
- The percentage of Russell 1000 companies publicly disclosing that they offer employee matching gifts grew by 11.8% in the last three years, reaching 51%.
- The percentage of Russell 1000 companies offering an “Unrestricted Matching Gift Program” grew over 48% over the last three years, while Russell 1000 Companies offering “Restricted” programs decreased by 33% to only 13.6% in the same time frame.
- 97% of donors want flexibility in where and how they give to causes they care about. Donors want the option to be able to give directly to a nonprofit and for their company to allow matching gifts for any nonprofit of their choosing.
- 84% of donors reported a higher likelihood of donating if a match is offered, and 1 in 3 donors indicated they’d make a larger gift if matching is applied to their donation.
- 360MatchPro’s automation platform increases matching gift revenue for nonprofits by 61%.
- 93-99% of Canadian employees who work for a matching gift company will find their employer in Double the Donation’s database.
The takeaway? Corporate philanthropy, and specifically workplace giving, offers a powerful fundraising source, though it continues to be underutilized by nonprofits everywhere. Matching gifts are a particularly easy way to get started, so invest in improving or starting a matching gift fundraising push.
Additional Resources on Nonprofit Fundraising
Statistics provide your nonprofit with a useful baseline to measure your own efforts and make strategic decisions about future projects. When exploring statistics, remember to take the full range of nonprofits—from one-man teams to globe-spanning operations—into account. This means most nonprofits will find themselves perfectly aligning with some stats and straying far from others.
To get an even broader understanding of modern nonprofit and fundraising statistics, explore these resources:
- 15+ Powerful CSR Statistics About The Impact of Giving Back. Understanding the state of corporate social responsibility and company giving can help your nonprofit better connect with businesses. Discover statistics related to CSR to stay up to date.
- 5 Trends in Corporate Philanthropy That Dictate the Future. Corporate philanthropy is changing, and staying on top of trends with this guide can help your nonprofit secure corporate funding.
- Volunteering Statistics for 2024: Explore Key Insights. Volunteers play an essential role in your nonprofit’s success. Learn how volunteer strategies are shifting with these statistics.